Marketing-sourced pipeline is only as credible as the methodology behind it, and most pipeline claims in content marketing fall apart the moment you ask “how did you measure that?” This article is a transparent breakdown of how I tracked and attributed 48% marketing-sourced pipeline and over €230K in pipeline value as a solo content marketer at a B2B SaaS company: the attribution model, the content types that drove it, the conditions that made it possible, and where the methodology gets honestly messy.
I’ve used the 48% in a handful of articles on this blog, as proof in the AEO/LLMO framework piece, the multi-persona strategy, the ICP pivot and the content system argument, and never once explained the method behind it. That’s a problem, because most pipeline claims in content marketing fall apart the second someone asks how they were measured, and plenty of marketers can’t answer: 56% said attributing ROI to content was a challenge in the Content Marketing Institute’s 2025 B2B research, and in its 2026 edition a third still named measuring content effectiveness as one of their top three challenges. So this is the whole method, including the parts I didn’t own.
What does 48% marketing-sourced pipeline actually mean?
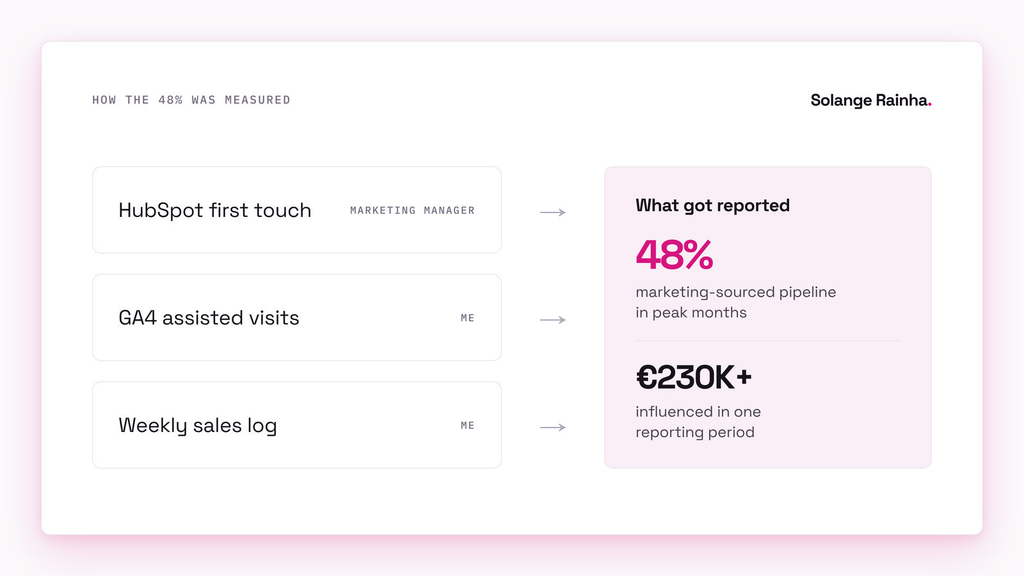
In peak months, just under half of all new pipeline at the company came in through something marketing did first: a content download, a blog visit that turned into a demo request, a LinkedIn click that became a conversation, an organic search visit that converted. That’s what marketing-sourced pipeline means here, and the denominator is the part to check before you get impressed by the percentage. The rest came from sales outbound, referrals, partnerships and events, with marketing as the biggest single source and content as the main driver inside marketing’s share.
The €230K+ is pipeline value from a single reporting period, all of it marketing-sourced, and I say content influenced it rather than generated it, because content was the main driver of that pipeline, not the only source of it. It’s also pipeline rather than closed revenue (some of those deals closed and some didn’t), and mixing the two up is one of the fastest ways to lose a CFO’s trust, which is why I argue for content marketing metrics that start at pipeline contribution and treat traffic as supporting evidence.
| Measure | What counts | What it tells you | What it can’t tell you |
|---|---|---|---|
| Marketing-sourced pipeline | Deals where marketing created the first meaningful interaction | How much new pipeline marketing starts | What happened between first touch and the deal |
| Marketing-influenced pipeline | Deals marketing touched at any point | How far marketing reaches into active deals | Whether those deals would’ve happened anyway |
| Closed revenue | Deals won | What the business banked | How much content caused, once sales, pricing and timing are in the mix |
The 48% and the €230K+ both sit in the first row, and neither one belongs in the third.
How was marketing-sourced pipeline attribution tracked?
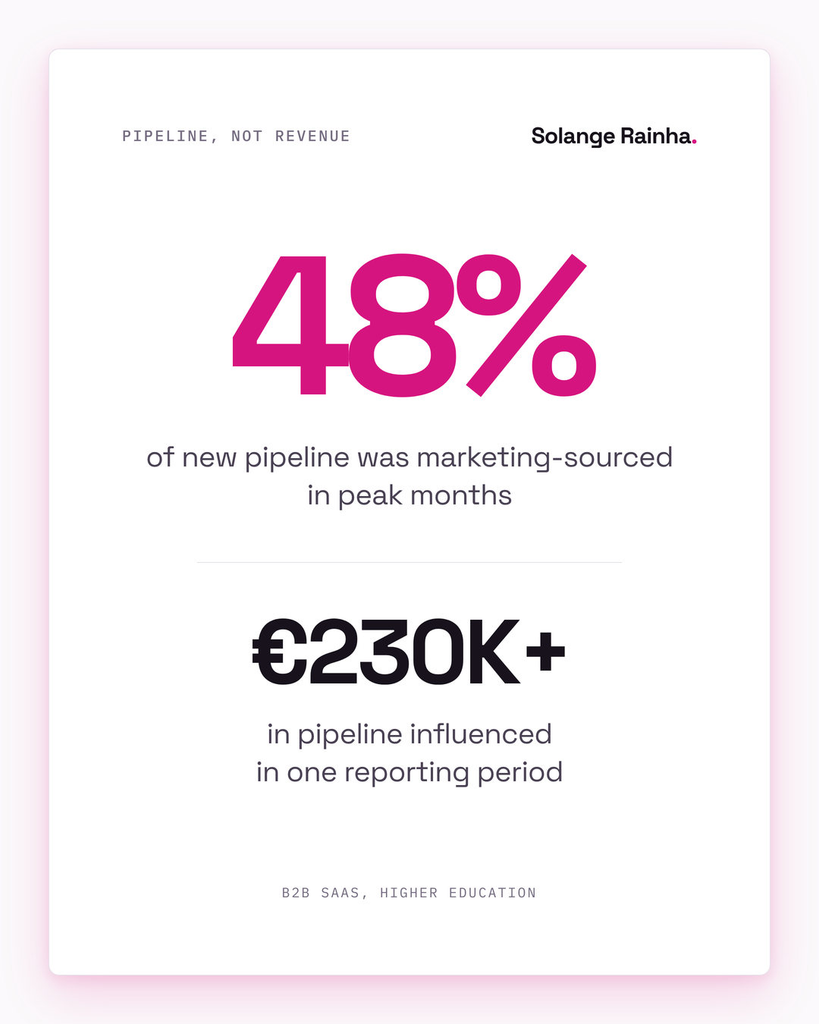
Our marketing manager owned the HubSpot side, including the attribution model and the lead scoring, and produced the pipeline reports. I added two layers on top: GA4 tracking of how content got used, and a manual log of what sales saw in live deals. I’ve written about why the judgement layer is the part of measurement a content marketer should own, and this is what that looked like day to day.
First touch, through HubSpot. When a new contact entered the CRM, HubSpot recorded the source: organic search, social, direct, paid or email. For contacts who came in through content (a blog post, an ebook download, a landing page form), HubSpot logged the specific piece as the first touch and carried it through to the deal when that contact entered pipeline. It was the cleanest layer and the one the pipeline reports leaned on, so if a prospect downloaded an ebook on choosing enterprise software for higher education and later asked for a demo, the ebook got the credit.
The GA4 layer was mine, and it caught content that helped a deal it didn’t start. Plenty of prospects found the company through a sales referral or a conference, then spent serious time on the blog, product pages and landing pages before they moved. I reported those assisted visits separately from sourced pipeline, because counting content that supports a deal as content that started it inflates the figure until nobody trusts it. If you’re setting GA4 up for this today, it’s worth tracking AI traffic in GA4 from the start too, since a growing slice of those assisted visits comes from AI answers.
The sales log was a spreadsheet and one question. Some content influence never makes a click: a rep sends a blog post during a negotiation, a prospect mentions reading the security documentation before the call, a CIO brings up the architecture overview in a technical evaluation, and none of it shows up in a dashboard. I asked sales the same question in our check-ins, “Did any content come up in your conversations this week?”, and logged the answers next to the automated data.
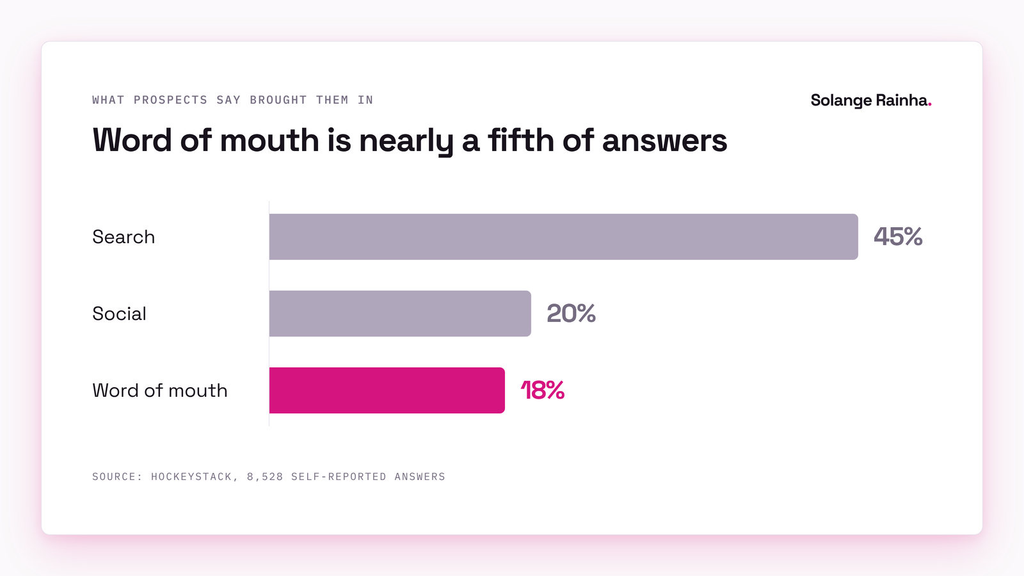
That manual layer earns its keep: when HockeyStack, which sells attribution software, compared 8,528 self-reported answers from high-intent B2B prospects with the last touch its software recorded, the majority didn’t match, and word of mouth, which no software tracks, came third at 18% of answers. Steffen Hedebrandt, co-founder of the attribution platform Dreamdata, told Demand Gen Report where CRM-based attribution runs out:
“proving marketing’s impact is difficult, since CRMs aren’t built to track multiple anonymous touchpoints”
| Layer | Owner | What it caught | What it missed | How we used it |
|---|---|---|---|---|
| HubSpot first touch | Marketing manager | The piece of content that brought a contact in | Everything after that first interaction | Primary model for the pipeline reports |
| GA4 assisted visits | Me | Content read by prospects who arrived another way | Anything without a tracked visit | Reported separately from sourced pipeline |
| Weekly sales log | Me | Content shared or mentioned in live deals | Anything sales forgot or never heard about | Added context to the automated data, mostly for enablement |
Which content types drove the most pipeline?
It depended on the funnel stage and the persona, but five patterns held across the time I was there.
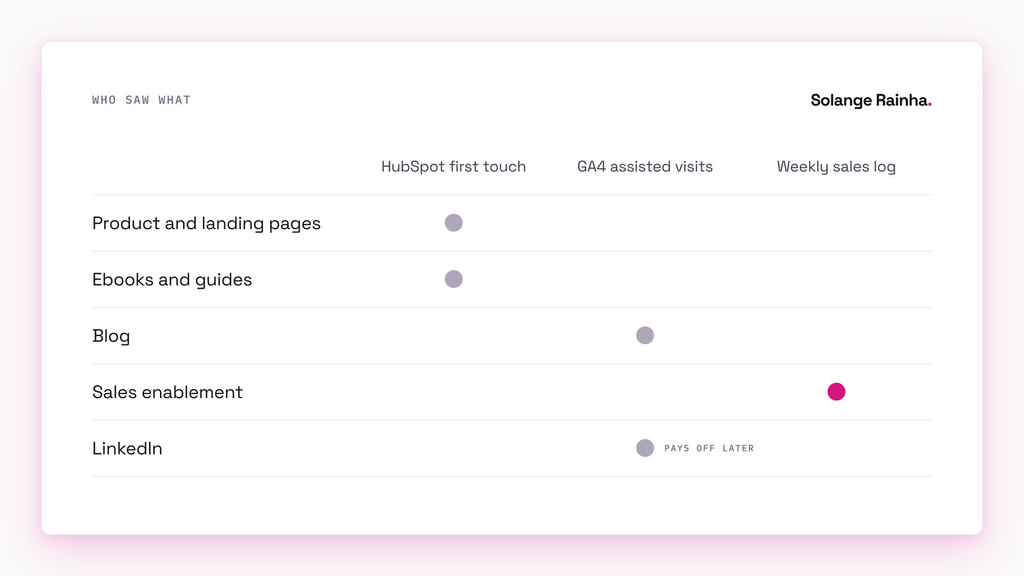
- Bottom-of-funnel product pages and persona-specific landing pages were the most directly attributable. Prospects evaluating the platform spent their time there before asking for a demo, so the path from landing to pipeline was short and clean.
- Ebooks and guides were the strongest top-of-funnel source of pipeline. Gated downloads brought new contacts into the CRM, and those contacts converted to demo requests at a higher rate than people who came in through ungated blog posts, I think because trading an email for a guide signals more intent than skimming an article, even when plenty of people never read past the first page.
- The blog had the longest path to pipeline and the widest reach. Posts rarely sourced a deal directly, but they drove organic traffic, built topical authority, carried the SEO and AEO/LLMO work and showed up as assisted visits across a lot of deals. Prospects who’d read two to four related posts before landing on a product page converted at a noticeably higher rate than people who arrived cold.
- Sales enablement (one-pagers, competitive positioning docs, prospect-facing collateral) was the hardest to see in analytics and the most valued by sales, and its attribution came almost entirely from the sales log. When I rewrote the sales materials during the ICP pivot, the new collateral quickly started turning up in sales feedback on active deals.
- LinkedIn did slow work. I tracked impressions, click-throughs and engagement rates that stayed above 12% (the LinkedIn playbook behind that is its own article), and I could see LinkedIn-referred contacts entering the CRM. Most of its value lands later, because research by Professor John Dawes with LinkedIn’s B2B Institute found only 5% of B2B buyers are in-market at any given time, as Marketing Week reported.
What conditions made 48% marketing-sourced pipeline possible?
A working content system and a CRM someone had already set up properly made it possible, not one great piece of content, and without those conditions I’d have been producing content nobody could trace.
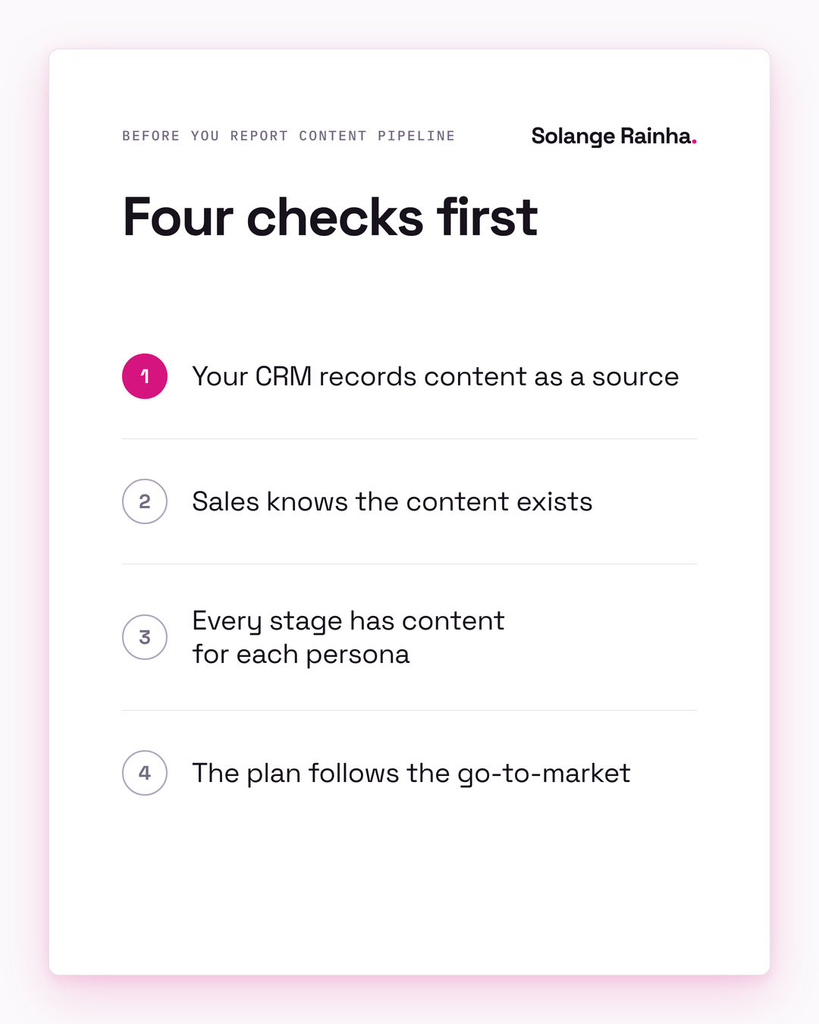
- The CRM captured content before anyone reported on it. Our marketing manager owned HubSpot, with source tracking, UTM parameters, landing page attribution and download tracking feeding the pipeline reports. Most content marketers who can’t show pipeline impact have a measurement problem rather than a performance problem, and if your CRM doesn’t record content as a source, fix that before you write another post.
- Sales knew the content existed and used it. I built enablement materials alongside the content calendar, briefed sales when a new piece went live and kept a feedback loop going, because content the sales team never hears about might as well not exist.
- Every stage had content for every persona I was writing for. Blog and LinkedIn for awareness, ebooks, guides and comparison content for consideration, product pages, landing pages and enablement for the decision, all built in a full-funnel content strategy across five buyer personas. A gap in the middle would have broken the chain, with prospects arriving through a blog post and hitting a dead end.
- The content plan followed the go-to-market plan. Every piece existed for a reason (which personas were closest to buying, which deals sales needed help with, where the gaps were), I never made anything just because we hadn’t posted in a while, and when the ICP changed mid-quarter, the priorities changed with it.
Where does marketing-sourced pipeline attribution get messy?
First-touch squashes a long buying process into one moment and misses most of the quiet influence around it, and content never worked alone anyway.
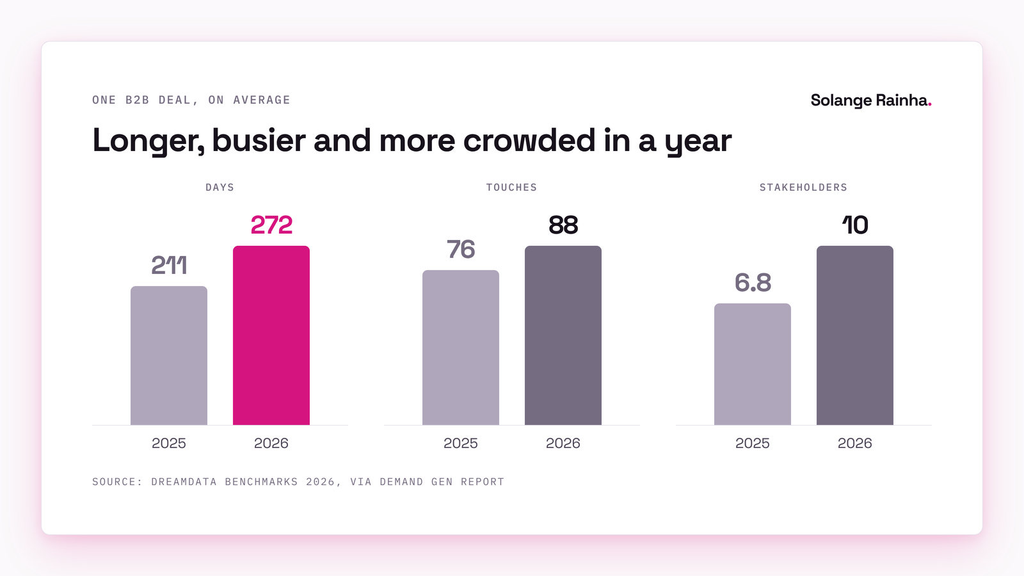
Every model simplifies, and first-touch simplifies a lot. Dreamdata’s 2026 benchmarks put the average B2B customer journey at 272 days, 88 touches and 10 stakeholders, up from 211 days, 76 touches and 6.8 stakeholders a year earlier, according to Demand Gen Report. If a prospect reads four blog posts, downloads an ebook, sits through a webinar, gets a cold email and then asks for a demo, first-touch gives the deal to the blog post and last-touch gives it to the email, and neither is the whole story. The pipeline reports used first-touch as the primary model, which favours the channel that starts the relationship, and whenever I reported content’s share I said so.
Dark social and offline influence happen constantly: a prospect mentions the company to a colleague or drops a blog post into a private Slack channel, and a CIO reads the security documentation on their phone without clicking anything tracked. Buyers also arrive late: in 6sense’s 2025 Buyer Experience Study, buyers first contacted sellers 61% of the way through the buying process, and 94% had already ranked their shortlist. So the 48% captures what was measurable; the content influence was almost certainly higher, but I can’t prove that with the tools we had. It’s the same gap I deal with now when I measure AI visibility without analytics.
Correlation and causation get tangled too. When content-sourced deals rise in the same quarter organic traffic grows 33%, it’s tempting to draw a straight line between them, but email, paid ads, events and sales outbound were all running alongside content, and isolating content’s effect would’ve taken controlled experiments that weren’t realistic for a marketing team our size.
What would I do differently to improve attribution?
I’d change four parts of how it worked, and only one is about tools.
- I’d push for multi-touch attribution tooling earlier. I didn’t own the CRM, but I could have made the case sooner for a platform like Dreamdata or HockeyStack (both vendors, and both cited above), because first-touch told us where deals started and almost nothing about which mid-funnel content did the heavy lifting.
- I’d build conversion paths into the best blog posts much earlier. Some of my highest-traffic posts had weak next steps, so a reader would finish a good article and leave; contextual CTAs, related content and a gated asset at the right point would have turned more of that traffic into CRM contacts.
- The sales check-in needed structure. The question in our check-ins was useful but inconsistent, and a five-minute weekly slot just for content usage would have given me better data on how enablement materials moved deals.
- I’d push for event-triggered content follow-up sooner. When someone downloads a whitepaper, the follow-up should be about that whitepaper, not a generic nurture email; some of this ran through HubSpot workflows, but I could have pushed harder for content-specific sequences, and the AEO/LLMO framework I was building at the same time would have made the content they triggered easier to cite.
Frequently asked questions
Marketing-sourced pipeline refers to deals in a company’s sales pipeline where the first meaningful touchpoint was a marketing activity such as a content download, blog visit that led to a demo request, LinkedIn campaign click that converted into a conversation, or organic search landing that led to a conversion. It’s measured as a percentage of total new pipeline in a given period. The 48% figure reported here means that in peak months, just under half of new pipeline at a B2B SaaS company serving 200+ higher education institutions entered the funnel through a marketing-initiated touchpoint, with content as the primary driver within the marketing bucket.
Attribution requires three layers working together: first-touch attribution through the CRM (recording which specific piece of content was the initial touchpoint when a contact enters the system), assisted-touch tracking through GA4 (monitoring content interactions that influenced but didn’t source the deal), and manual touchpoint tracking through regular sales conversations (capturing content influences that don’t create trackable clicks, like a prospect mentioning they read the security documentation before a call). CRM integration with proper source tracking, UTM parameters, and landing page attribution needs to be in place before measurement begins, because without it, attribution is guesswork.
Pipeline value represents the total potential value of deals in the sales pipeline at a given point, while revenue is the actual closed-won amount. The €230K figure cited in this article is pipeline value, not closed revenue, because some of those deals closed and some didn’t. The distinction matters because conflating pipeline with revenue is one of the most common credibility mistakes in content marketing reporting. Pipeline is a leading indicator that shows marketing’s contribution to creating sales opportunities, while revenue attribution requires tracking deals through to close and accounting for sales execution, pricing negotiation, and competitive losses that content marketing cannot control.